Note
Click here to download the full example code
Different filtering strategies
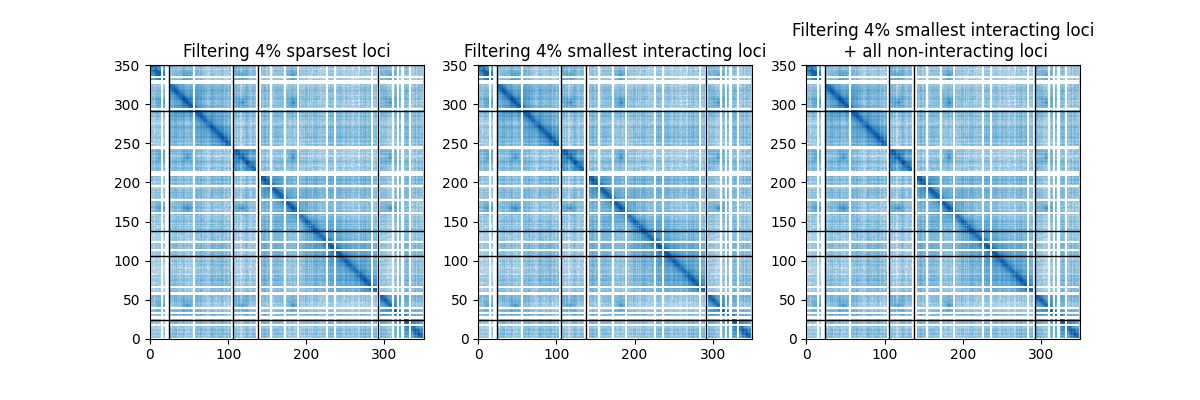
iced provides different filtering strategies. In short:
filtering rows and columns that are the most sparse.
filtering of the smallest x% rows and columns in terms of interactions
filtering of the smallest x% interacting rows and columns

Out:
/home/travis/build/hiclib/iced/iced/io/_io_pandas.py:56: UserWarning: Attempting to guess whether counts are 0 or 1 based
  warnings.warn(

Text(0.5, 1.0, 'Filtering 4% smallest interacting loci\n + all non-interacting loci')
import matplotlib.pyplot as plt
from matplotlib import colors

from iced import datasets
from iced import filter


# Loading a sample dataset
counts, lengths = datasets.load_sample_yeast()


fig, axes = plt.subplots(ncols=3, figsize=(12, 4))
counts_1 = filter.filter_low_counts(counts, lengths=lengths, percentage=0.04)
counts_2 = filter.filter_low_counts(counts, lengths=lengths, percentage=0.04,
                                    sparsity=False)
counts_3 = filter.filter_low_counts(counts, lengths=lengths, percentage=0.04,
                                    sparsity=False, remove_all_zeros_loci=True)


# Plotting the results using matplotlib
chromosomes = ["I", "II", "III", "IV", "V", "VI"]


for ax, c in zip(axes, [counts_1, counts_2, counts_3]):
    ax.imshow(c, cmap="Blues", norm=colors.SymLogNorm(1),
              extent=(0, len(counts), 0, len(counts)))

    [ax.axhline(i, linewidth=1, color="#000000") for i in lengths.cumsum()]
    [ax.axvline(i, linewidth=1, color="#000000") for i in lengths.cumsum()]

axes[0].set_title("Filtering 4% sparsest loci")
axes[1].set_title("Filtering 4% smallest interacting loci")
axes[2].set_title("Filtering 4% smallest interacting loci\n + all "
                  "non-interacting loci")
Total running time of the script: ( 0 minutes 0.399 seconds)