Note
Go to the end to download the full example code. or to run this example in your browser via Binder
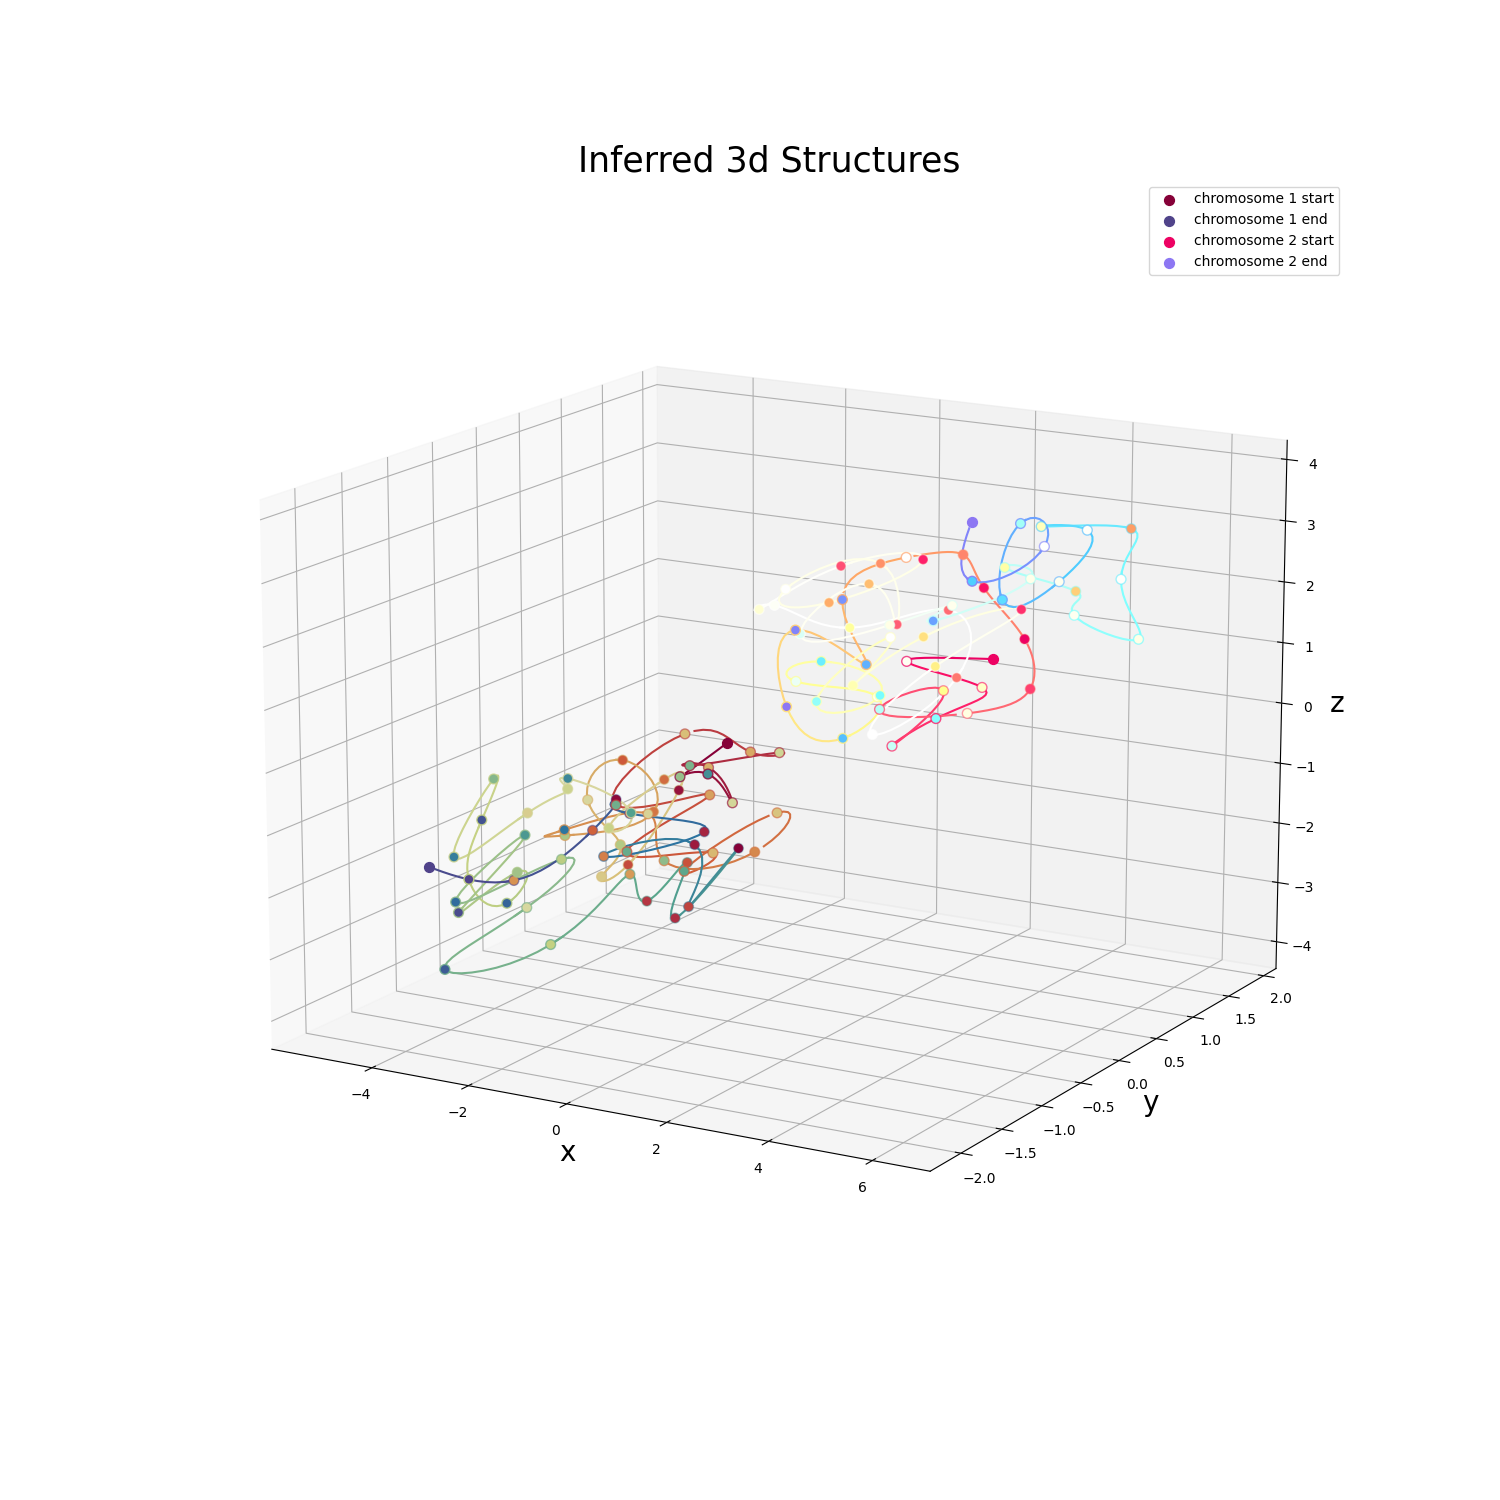
This example showcases how to plot an inferred 3D structure output by PASTIS using matplotlib.
import numpy as np
import matplotlib
import matplotlib.pyplot as plt
from mpl_toolkits.mplot3d.art3d import Line3DCollection
from scipy import interpolate


def modify_cmap(function, cmap):
    """Lighten or darken a given colormap.

    Applies function (which should operate on vectors of shape 3:
    [r, g, b]), on colormap cmap. This routine will break any discontinuous
    points in a colormap.

    Adapted from:
    https://scipy-cookbook.readthedocs.io/items/Matplotlib_ColormapTransformations.html
    """
    cdict = cmap._segmentdata
    step_dict = {}
    # Get the list of points where the segments start or end
    for key in ('red', 'green', 'blue'):
        step_dict[key] = list(map(lambda x: x[0], cdict[key]))
    step_list = sum(step_dict.values(), [])
    step_list = np.array(list(set(step_list)))

    # Compute the LUT, and apply the function to the LUT
    def reduce_cmap(step):
        return np.array(cmap(step)[0:3])
    old_LUT = np.array([reduce_cmap(x) for x in step_list])
    new_LUT = np.array([function(x) for x in old_LUT])

    # Try to make a minimal segment definition of the new LUT
    cdict = {}
    for i, key in enumerate(['red', 'green', 'blue']):
        this_cdict = {}
        for j, step in enumerate(step_list):
            if step in step_dict[key]:
                this_cdict[step] = new_LUT[j, i]
            elif new_LUT[j, i] != old_LUT[j, i]:
                this_cdict[step] = new_LUT[j, i]
        colorvector = list(map(lambda x: x + (x[1], ), this_cdict.items()))
        colorvector.sort()
        cdict[key] = colorvector

    return matplotlib.colors.LinearSegmentedColormap('colormap', cdict, 1024)


def interpolate_chromosome(chrom, eps=0.1):
    """Interpolate a smooth line between the beads of a given chromosome.

    Should only be run on a single chromosome molecule.

    Parameters
    ----------
    chrom : array of float
    The 3D structure of a given chromosome (nbeads, 3).

    eps : float, optional
    Frequency of points to be interpolated. A value of '1' simply replaces any
    NaN beads with interpolated values, but does not form a line connecting
    between adjacent beads.

    Returns
    -------
    chrom_interp : array of float
    The smoothed 3D structure for the given chromosome.
    """

    # Select non-NaN beads
    mask = np.invert(np.isnan(chrom[:, 0]))
    if mask.sum() < 2:
        return None  # Skip chromosomes with < 2 non-NaN beads

    x = chrom[mask, 0]
    y = chrom[mask, 1]
    z = chrom[mask, 2]

    # Get interpolation functions for the x, y, and z coordinates
    bead_idx = np.arange(chrom.shape[0])[mask]
    f_x = interpolate.Rbf(bead_idx, x, smooth=0)
    f_y = interpolate.Rbf(bead_idx, y, smooth=0)
    f_z = interpolate.Rbf(bead_idx, z, smooth=0)

    # Use interpolation functions to create line segments between adjacent
    # coordinate beads
    line_idx = np.arange(bead_idx.min(), bead_idx.max() + eps, eps)
    chrom_interp = np.array([f_x(line_idx), f_y(line_idx), f_z(line_idx)]).T

    return chrom_interp


def plot_chromosome(chrom, ax=None, cmap=None, name=None, bead_size=50):
    """Plot a single chromosome molecule on the supplied axis.

    Beads are represented as translucent circles, and a line is interpolated
    between adjacent beads. Should only be run on a single chromosome molecule.

    Parameters
    ----------
    chrom : array of float
    The coordinates of the 3D structure of a given chromosome,
    shape=(nbeads_chrom, 3).

    ax : matplotlib.axes.Axes object, optional
    The matplotlib axis on which to plot the chromosome. If absent, a new
    figure will be created.

    cmap : matplotlib.colors.Colormap object, optional
    The matplotlib colormap with which to color the beads and lines.

    name : str, optional
    The name for the given chromosome, to be displayed in the plot legend.

    bead_size : int, optional
    Size for each bead in the plotted 3D structure.

    Returns
    -------
    ax : matplotlib.axes.Axes object
    The matplotlib axis on which the chromosome has been plotted.
    """

    if cmap is None:
        cmap = matplotlib.colormaps['Spectral']
    if ax is None:
        fig = plt.figure(figsize=(15, 15))
        ax = fig.add_subplot(111, projection='3d')
        ax.set_xlabel('x', fontsize=20)
        ax.set_ylabel('y', fontsize=20)
        ax.set_zlabel('z', fontsize=20)
        ax.view_init(15, 300)
    if name is None:
        name = ""
    elif name != "":
        name = f"{name} "

    # Select non-NaN beads
    mask = np.invert(np.isnan(chrom[:, 0]))
    if mask.sum() == 0:
        return ax  # Chromosome beads are all NaN, nothing to plot

    # Determine which color in our colormap each bead will have
    bead_color_idx = np.linspace(0, 1, chrom.shape[0])[mask]

    # Plot the beads for the current chromosome
    x = chrom[mask, 0]
    y = chrom[mask, 1]
    z = chrom[mask, 2]
    ax.scatter(x[0], y[0], z[0], s=bead_size, color=cmap(bead_color_idx[0]),
               label=f"{name}start")
    if x.shape[0] > 2:
        ax.scatter(x[1:-1], y[1:-1], z[1:-1], s=bead_size,
                   cmap=cmap, c=bead_color_idx[1:-1])
    ax.scatter(x[-1], y[-1], z[-1], s=bead_size,
               color=cmap(bead_color_idx[-1]), label=f"{name}end")

    # Interpolate the structure's beads to form a continuous line between beads
    chrom_interp = interpolate_chromosome(chrom)

    if chrom_interp is not None:
        # Determine which color in our colormap each line segment will have
        line_color_idx = np.linspace(
            bead_color_idx.min(), bead_color_idx.max(), chrom_interp.shape[0])

        # Plot this chromosome's interpolated coordinates as a continuous line
        # that connects between adjacent beads
        points = chrom_interp.reshape(-1, 1, 3)
        segments = np.concatenate([points[:-1], points[1:]], axis=1)
        lc = Line3DCollection(segments, cmap=cmap)
        lc.set_array(line_color_idx)  # Set the values used for colormapping
        lc.set_linewidth(2)
        ax.add_collection(lc)

    return ax
struct = np.loadtxt('data/struct_inferred.000.coords')
lengths = np.array([60, 60])  # Two chromosomes, each of which has 60 beads

# Setup figure: labels, title, and view angle/position
fig = plt.figure(figsize=(15, 15))
ax = fig.add_subplot(111, projection='3d')
ax.set_xlabel('x', fontsize=20)
ax.set_ylabel('y', fontsize=20)
ax.set_zlabel('z', fontsize=20)
plt.title('Inferred 3D structure', fontsize=25)
ax.view_init(15, 300)  # Set initial view angle & position

# We will use a spectral color cmap. Since we are plotting two chromosomes,
# let's make 'chromosome 1' a bit darker (hence x * 0.85) and 'chromosome 2'
# a bit lighter (hence x * 1.5). Feel free to twiddle with these configruations
# or change color maps entirely.
cmap1 = modify_cmap(lambda x: x * 0.85, cmap=matplotlib.colormaps['Spectral'])
cmap2 = modify_cmap(lambda x: x * 1.5, cmap=matplotlib.colormaps['Spectral'])
cmaps = [cmap1, cmap2]

# Plot each chromosome with its own colormap (to distinguish between chroms)
begin, end = 0, 0
for i, length in enumerate(lengths):
    end += length
    plot_chromosome(
        struct[begin:end], ax=ax, cmap=cmaps[i], name=f'chromosome {i + 1}')
    begin = end

# Update and show figure
plt.legend(loc='best')
plt.show()
Total running time of the script: (0 minutes 0.242 seconds)


