Note
Go to the end to download the full example code. or to run this example in your browser via Binder
Here, we show how to estimate the dispersion parameter with Pastis.
import matplotlib.pyplot as plt
import numpy as np
from iced import datasets
import iced
from pastis import dispersion
Load a Yeast dataset, and a human dataset
counts, lengths = datasets.load_sample_yeast()
/home/runner/miniconda3/envs/pastis/lib/python3.9/site-packages/iced/io/_io_pandas.py:56: UserWarning: Attempting to guess whether counts are 0 or 1 based
  warnings.warn(
Normalize the contact count data, but keep the biases to estimate the dispersion
counts = iced.filter.filter_low_counts(counts, percentage=0.06)
normed_counts, biases = iced.normalization.ICE_normalization(
    counts,
    output_bias=True)
Now, estimate the variance and mean for every genomic distance
Note that in order to have an unbiased estimation of the variance, you need to provide the bias vector.
_, mean, variance, weights = dispersion.compute_mean_variance(
    counts, lengths, bias=biases)
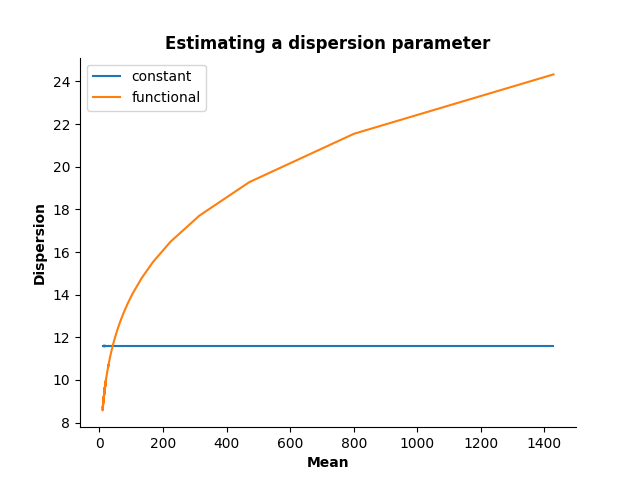
Now, estimate a constant and a functional dispersion parameter.
cst_disp = dispersion.ExponentialDispersion(degree=0)
cst_disp.fit(mean, variance, sample_weights=weights**0.5)

fun_disp = dispersion.ExponentialDispersion(degree=1)
fun_disp.fit(mean, variance, sample_weights=weights**0.5)
<pastis.dispersion.ExponentialDispersion object at 0x7fd403da1760>
Plot the dispersion as a function of the mean
fig, ax = plt.subplots()
ax.plot(mean, cst_disp.predict(mean), label="constant")
ax.plot(mean, fun_disp.predict(mean), label="functional")
ax.legend()

ax.set_xlabel("Mean", fontweight="bold")
ax.set_ylabel("Dispersion", fontweight="bold")
ax.set_title("Estimating a dispersion parameter", fontweight="bold")
ax.spines['right'].set_color('none')
ax.spines['top'].set_color('none')
ax.xaxis.set_ticks_position('bottom')
ax.yaxis.set_ticks_position('left')
Total running time of the script: (0 minutes 0.114 seconds)


