Note
Go to the end to download the full example code. or to run this example in your browser via Binder
Are Hi-C contact count data overdispersed?
import matplotlib.pyplot as plt
import numpy as np
from iced import datasets
import iced
from pastis import dispersion
Load a Yeast dataset, and a human dataset
counts, lengths = datasets.load_sample_yeast()
/home/runner/miniconda3/envs/pastis/lib/python3.9/site-packages/iced/io/_io_pandas.py:56: UserWarning: Attempting to guess whether counts are 0 or 1 based
  warnings.warn(
Normalize the contact count data, but keep the biases to estimate the dispersion
counts = iced.filter.filter_low_counts(counts, percentage=0.06)
normed_counts, biases = iced.normalization.ICE_normalization(
    counts,
    output_bias=True)
Now, estimate the variance and mean for every genomic distance
Note that in order to have an unbiased estimation of the variance, you need to provide the bias vector.
_, mean, variance, _ = dispersion.compute_mean_variance(
    counts, lengths, bias=biases)
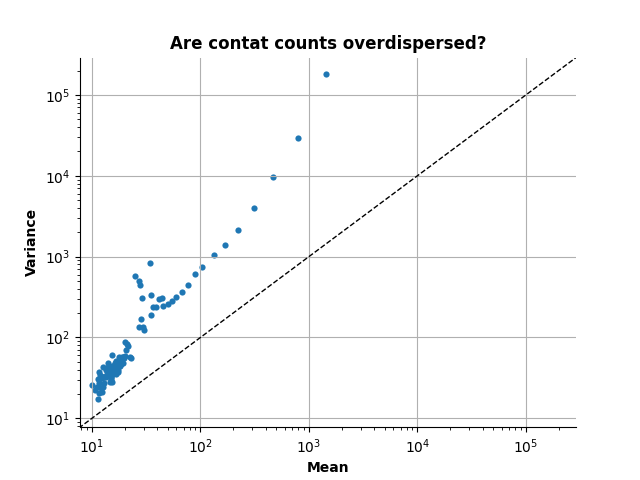
And now plot the resulting mean versus variance
fig, ax = plt.subplots()
s = ax.scatter(mean, variance, linewidth=0, marker="o",
               s=20)

ax.set_xscale("log")
ax.set_yscale("log")
ax.set_xlabel("Mean", fontweight="bold")
ax.set_ylabel("Variance", fontweight="bold")
xmin, xmax = ax.get_xlim()
ymin, ymax = ax.get_ylim()

ax.plot(np.arange(1e-1, 1e7, 1e6),
        np.arange(1e-1, 1e7, 1e6),
        linewidth=1,
        linestyle="--", color=(0, 0, 0))

ax.spines['right'].set_color('none')
ax.spines['top'].set_color('none')
ax.xaxis.set_ticks_position('bottom')
ax.yaxis.set_ticks_position('left')
ax.set_ylim((min(ymin, xmin), max(xmax, ymax)))
ax.set_xlim((min(ymin, xmin), max(xmax, ymax)))
ax.set_title("Are contat counts overdispersed?", fontweight="bold")

ax.grid("off")

Total running time of the script: (0 minutes 0.323 seconds)